

The 2026 US midterms, measured against the markets that priced them.
Hello,
In Issue 03, we promised to watch how prices moved across venues on US election night. This special analysis report follows that story through to the results. The major congressional markets favored Democratic control of both chambers, and the Associated Press has called both for the Democrats. The more revealing tests came further down the ballot, where some markets anticipated a change and others backed the losing candidate.[1][2][7]
The lesson for readers is straightforward: a market can identify the likely direction of an election while leaving substantial uncertainty about individual races. And a headline accuracy percentage can hide how little separated a winning forecast from a losing one.
Results note, November 7. We compare pre-election prices with reported counts published by election authorities and explicitly identified AP calls. State canvasses and certifications are still underway. A result published by an official source, a news organization’s call, and a marketplace’s settlement are different stages, and we label them accordingly.[2][5][6][17]
The results behind the prices
AP called Democratic control of the Senate at 11:36 p.m. Eastern on November 3, followed by the House at 1:24 a.m. on November 4. Those calls establish the projected direction of the next Congress; they do not mean every race has completed certification or that the new Congress has taken office.[2]
Two Texas races show why the individual markets deserve attention. The secretary of state’s November 4, 4:59 p.m. update recorded James Talarico with 5,444,982 Senate votes against Ken Paxton’s 4,249,373. In the governor’s race, it recorded Gina Hinojosa with 5,230,789 against Greg Abbott’s 4,524,527. Calculated from all listed candidates and write-ins, those are leads of 12.09 and 7.13 percentage points respectively. Both are reported, uncertified counts.[3]
South Carolina supplied another test. Its election commission’s midnight election-night spreadsheet put Annie Andrews at 1,034,418 votes and Darline Graham at 948,133, a 4.26-point lead across all reported Senate votes. This is a dated snapshot, not the latest completed count; the state has scheduled certification for November 10.[4][5]
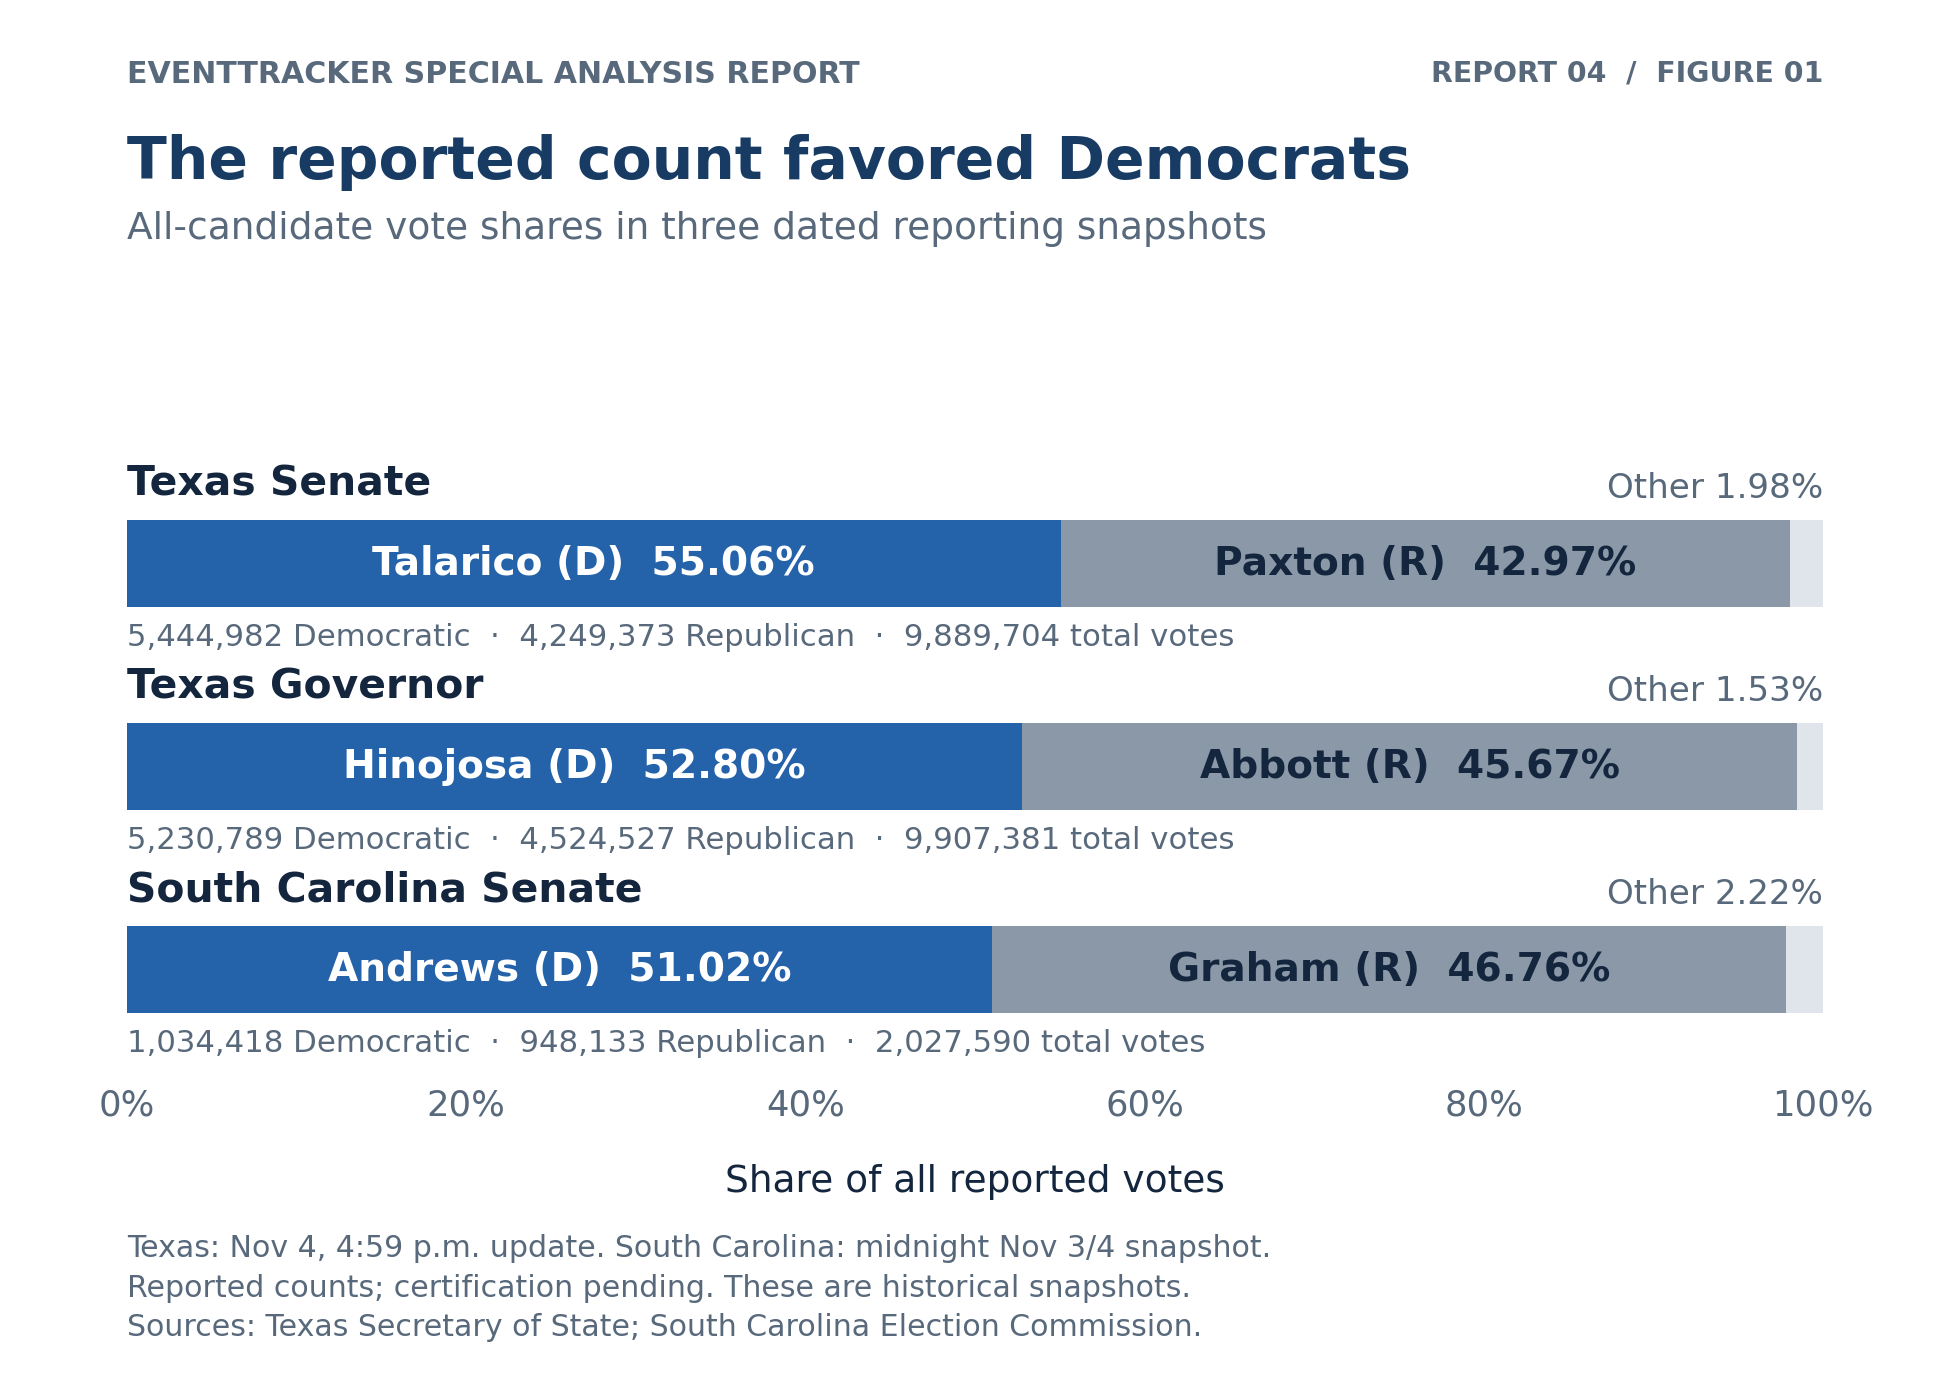
Figure 1. Shares of reported votes, including all listed candidates and write-ins. Texas uses the update printed November 4 at 4:59 p.m.; South Carolina uses the election-night midnight spreadsheet. These are dated, uncertified counts. Percentages are calculated from the full listed totals; rounding may prevent displayed labels from summing to exactly 100%.[3][4]
The broad markets got Congress right
For the main cross-venue comparison, we use one published snapshot: ThinBlimp’s prices frozen at 6:00 p.m. Eastern on November 3, when the first polls closed. This keeps the time consistent across venues. The figures are quoted prices expressed as implied probabilities; they are not forecasts of the percentage of votes a party would receive.[7]
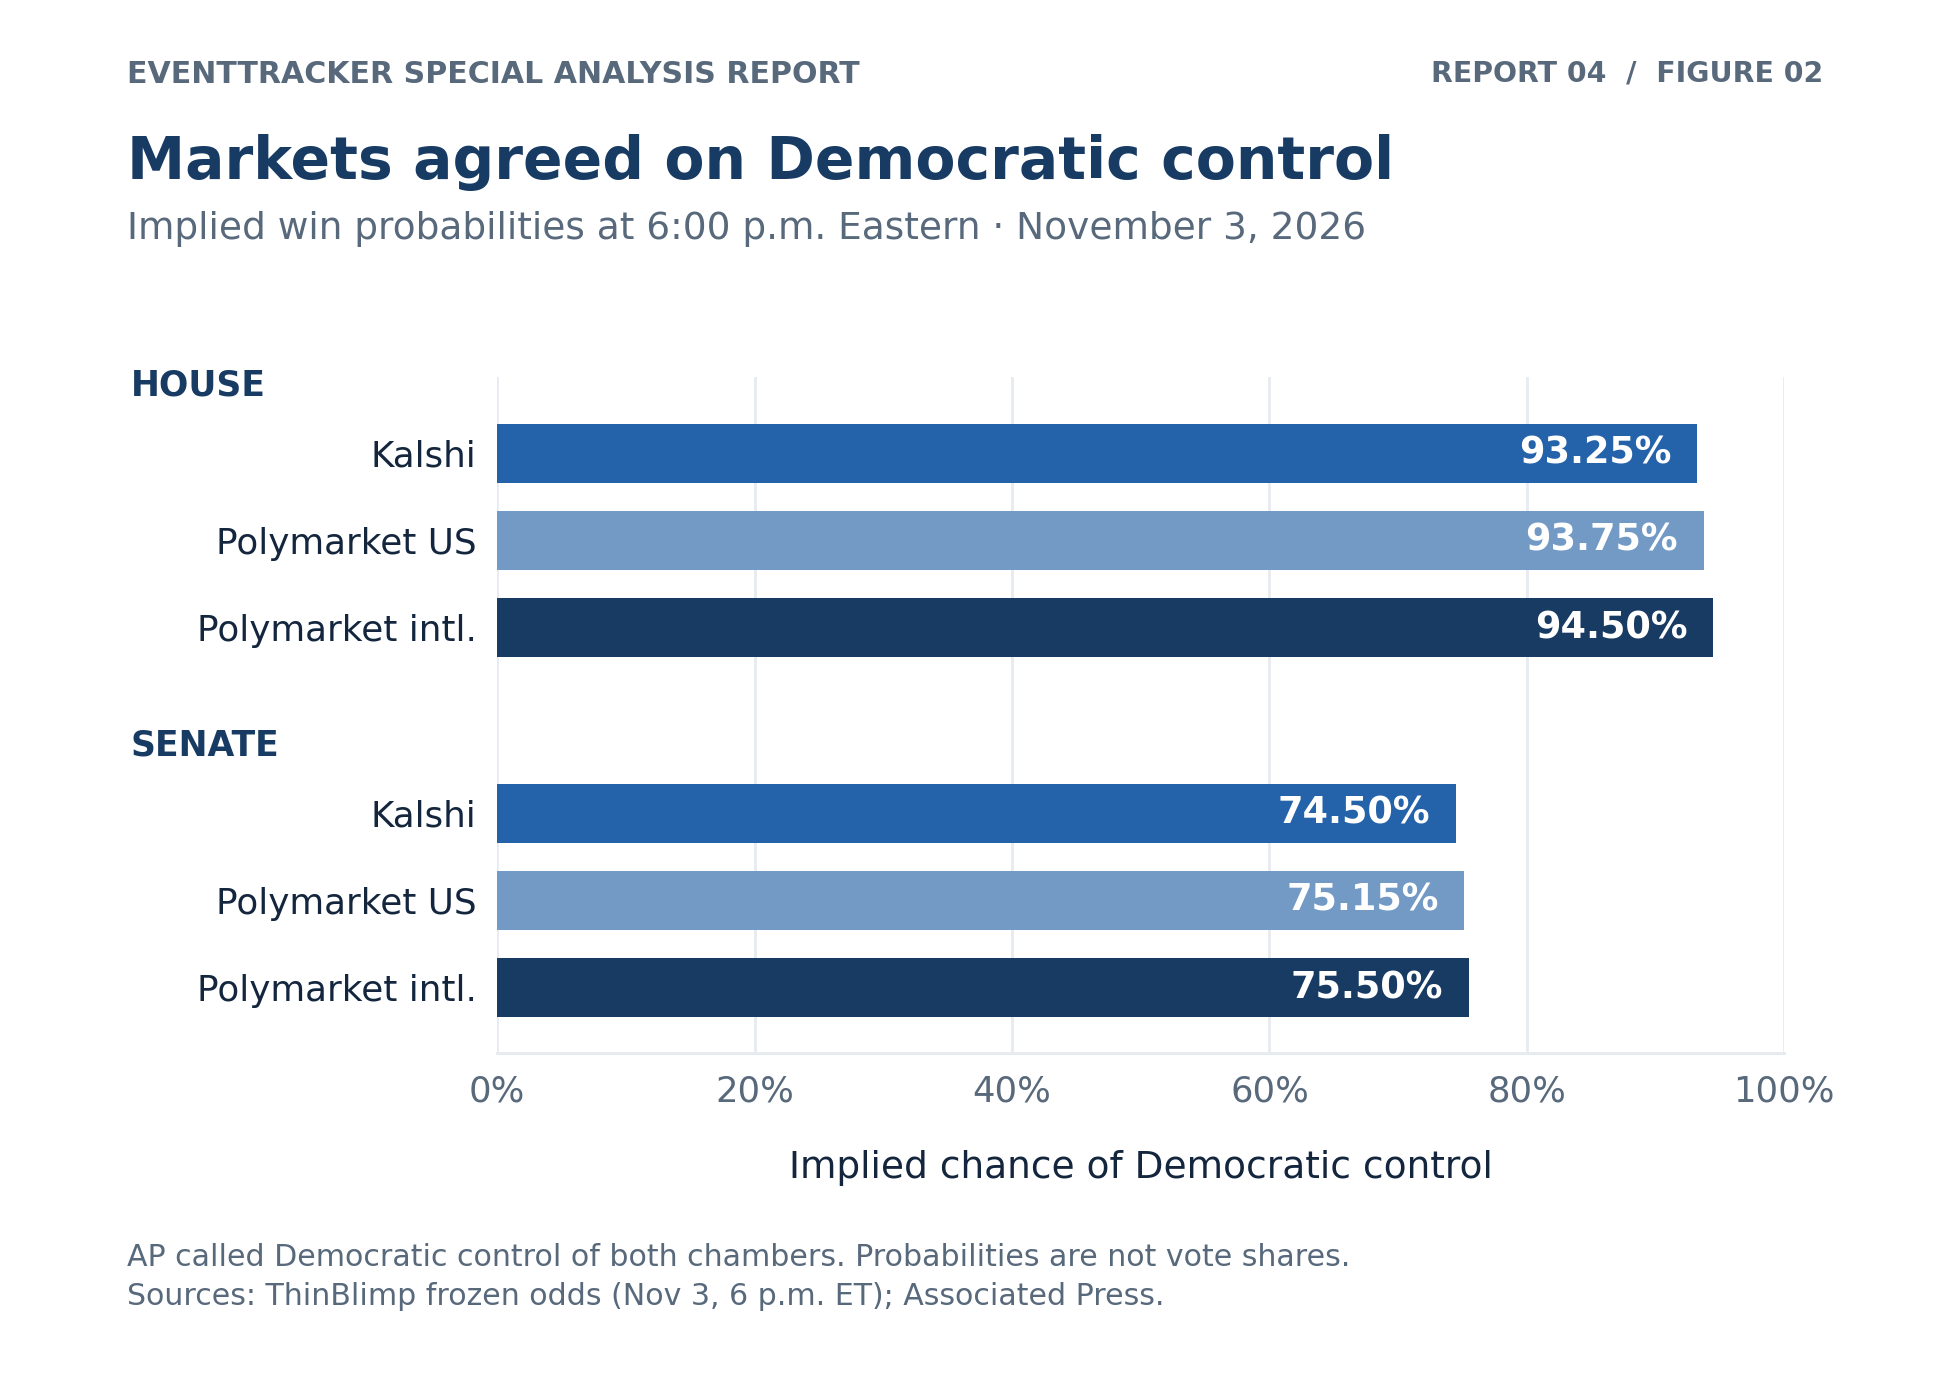
Figure 2. Prices implying Democratic control, frozen at 6:00 p.m. Eastern on November 3. The horizontal scale measures win probability, not vote share. AP subsequently called Democratic control of both chambers; state certifications were still pending.[7][2]
Table 1. Democratic control of Congress at the common cutoff
| Marketplace | House | Senate | Mean Brier score |
|---|---|---|---|
| Kalshi | 93.25% | 74.50% | 0.0348 |
| Polymarket US | 93.75% | 75.15% | 0.0328 |
| Polymarket international | 94.50% | 75.50% | 0.0315 |
Price source: ThinBlimp. Outcome benchmark: AP’s Democratic-control calls. Scores calculated here for these two contracts only; lower is better.[7][2]
We use a Brier score to retain the uncertainty in a forecast: square the difference between its probability and the outcome, coded as 1 for a Democratic win and 0 otherwise, then average. A certain, correct prediction scores zero; a 50% prediction scores 0.25.
On these two contracts, Polymarket international has the lowest score. The gap is small, and two closely related outcomes cannot establish an overall winner among exchanges. The useful finding is the broad agreement: a strong Democratic House favorite, with substantially more uncertainty about the Senate.
The races that tested the consensus
The same common-cutoff record shows where that agreement held and where it failed.
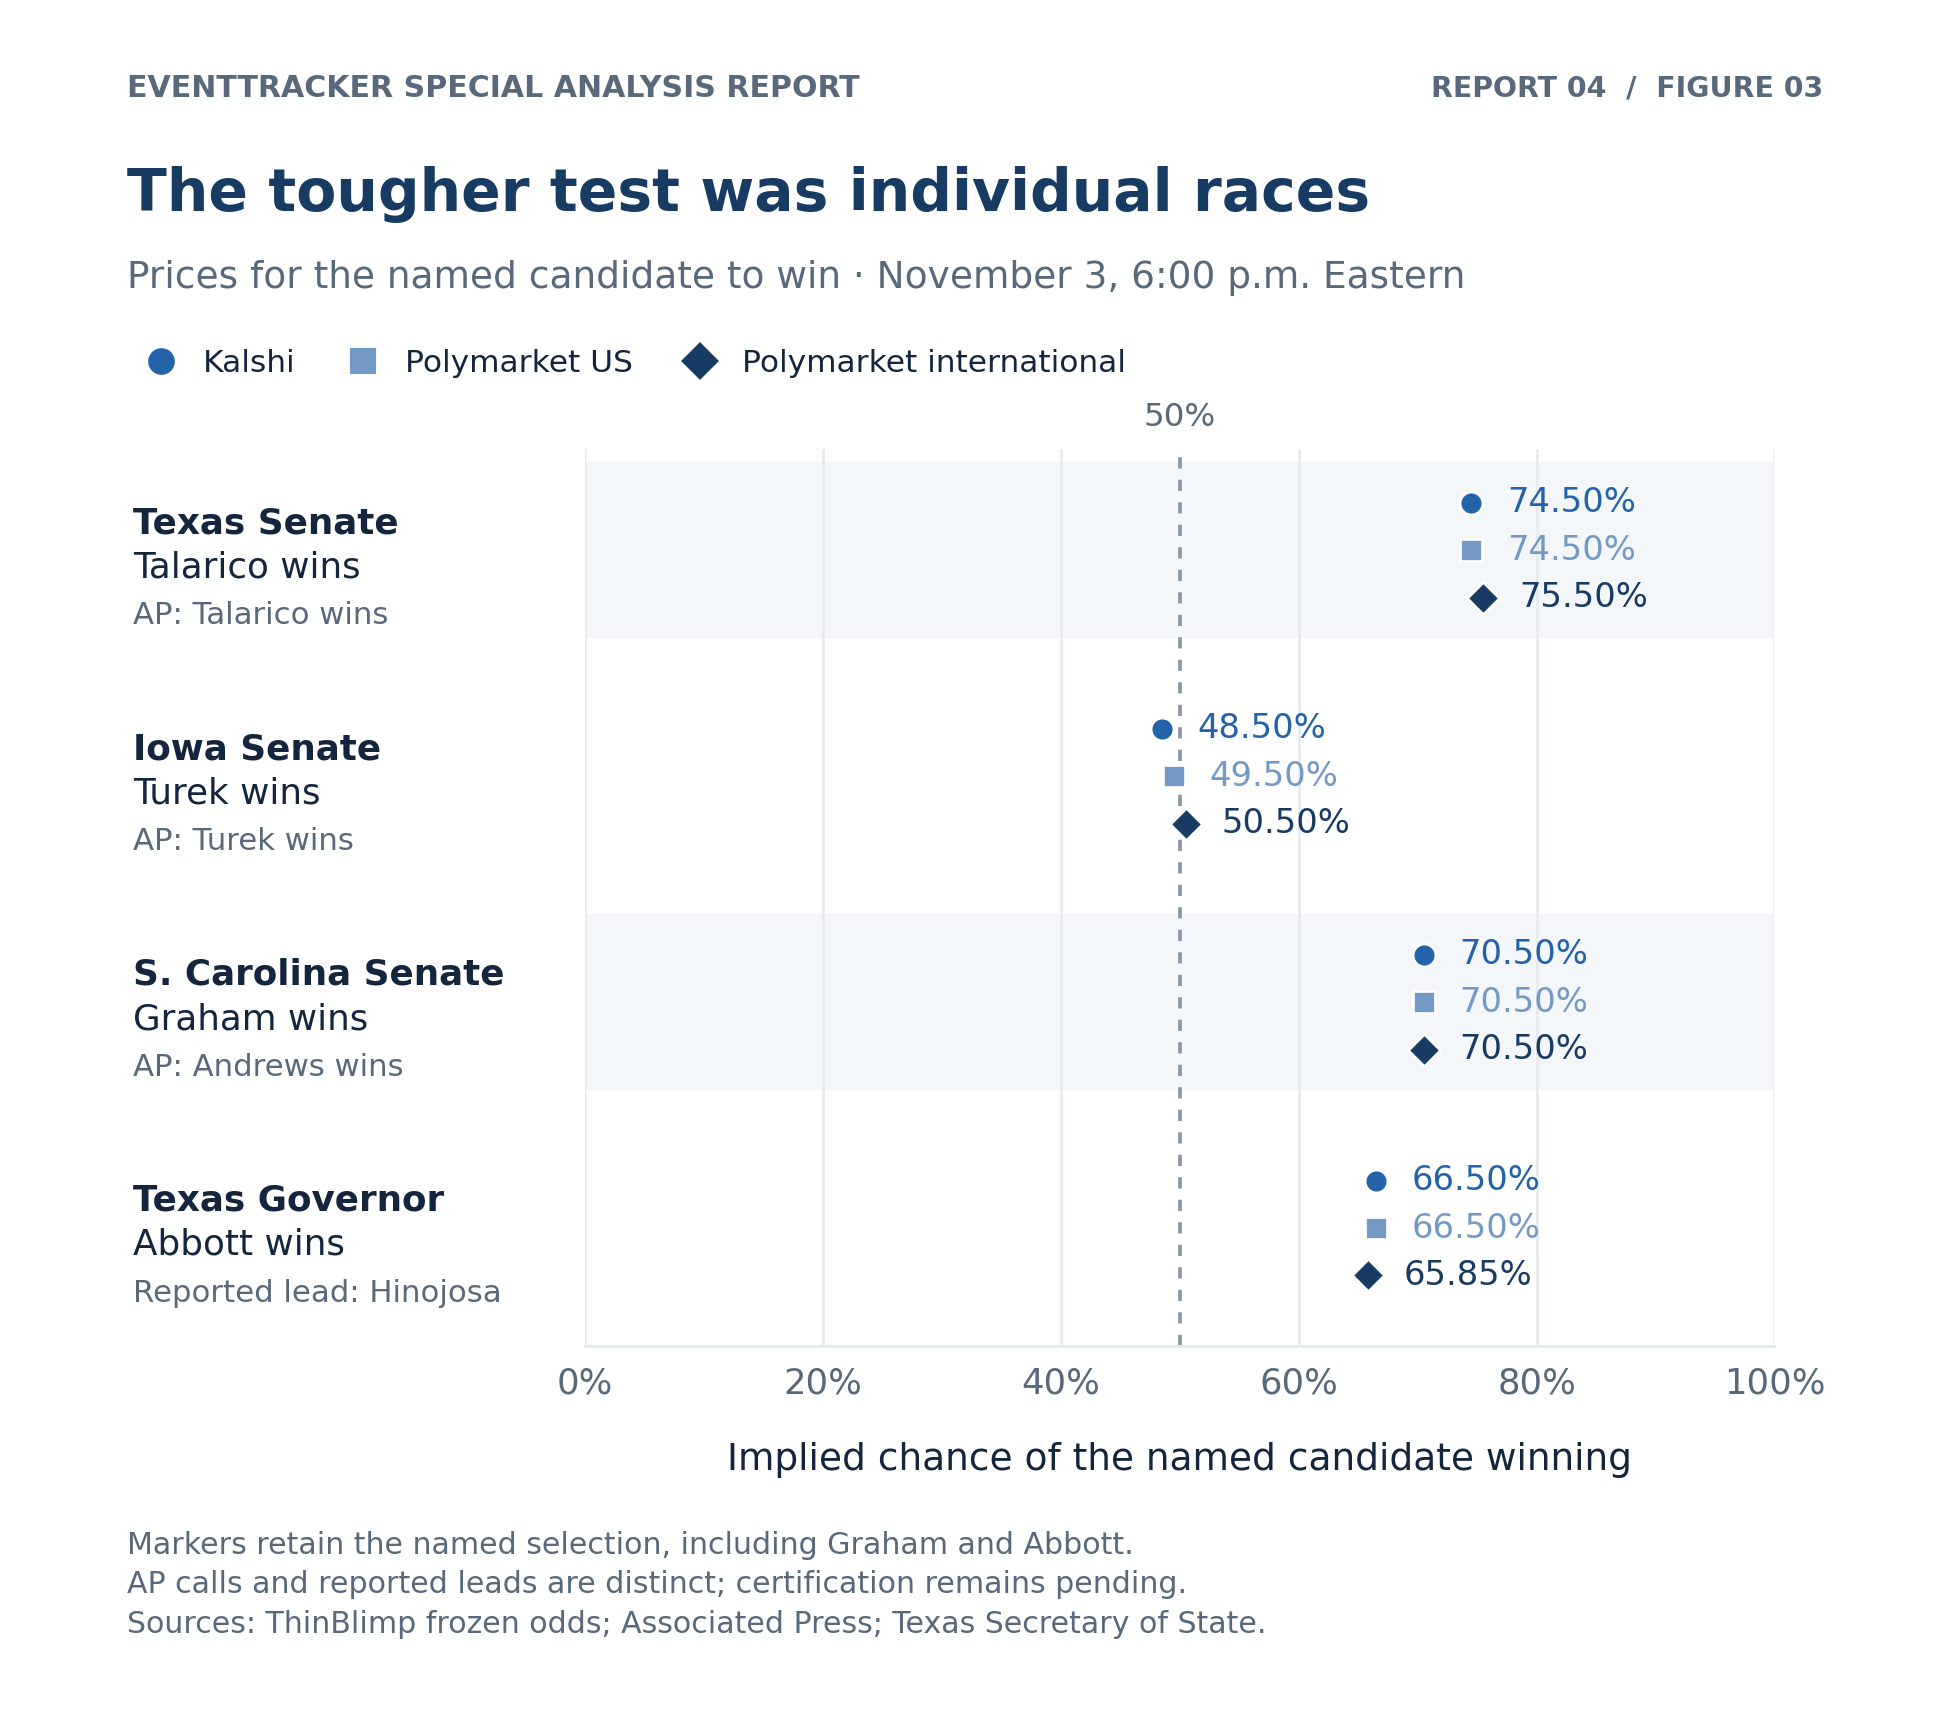
Figure 3. Each point prices the named selection at the common November 3 cutoff. Graham and Abbott remain the priced selections, so their quotes are not silently converted into probabilities for their opponents. AP called Talarico, Turek and Andrews winners; Hinojosa led the Texas official-source count. Certification remained pending.[7][2][3]
Table 2. Selected contracts at 6:00 p.m. Eastern, November 3
| Priced outcome | Kalshi | Polymarket US | Polymarket international | Reported result |
|---|---|---|---|---|
| Texas Senate Talarico wins |
74.5% | 74.5% | 75.5% | Talarico won* |
| Iowa Senate Turek wins |
48.5% | 49.5% | 50.5% | Turek won* |
| South Carolina Senate Graham wins |
70.5% | 70.5% | 70.5% | Andrews won* |
| Texas governor Abbott wins |
66.5% | 66.5% | 65.85% | Hinojosa leads official count |
Prices refer to the named selection, including the two losing Republican selections. *AP-called winners; certification pending. Texas and South Carolina official-source counts are described above. Iowa’s state canvass is scheduled for November 24.[7][2][3][4][6]
Texas rewarded one forecast and overturned another. The Senate market favored the candidate who subsequently led the official count. The governor market favored Abbott, even though the state’s reported count put Hinojosa ahead. A state’s partisan reputation is a poor substitute for reading each contest’s market and result separately.
South Carolina was a meaningful upset for market favorites. Kalshi’s own election-eve article had priced Andrews at 33% at noon on November 2. Her victory is compatible with that probability: a one-in-three outcome should happen sometimes. It still belongs in an honest account of which favored candidates lost.[14][2]
Iowa exposes the limits of a hit rate. Prices straddling 50% produce different “right” and “wrong” labels despite nearly identical uncertainty. Counting winners alone makes that tiny disagreement look larger than it was. Probability scoring gives a more faithful comparison.
Marketplace by marketplace
Kalshi. Its preliminary research paper reports 98.2% directional accuracy at each race’s poll closure and a Brier score of 0.016, using races called by 6:26 a.m. Eastern on November 4. That is strong performance within the published sample. Many races were safe seats, and later-closing states could already be influenced by returns elsewhere. The paper’s cutoff and sample therefore differ from our common-time comparison above.[8]
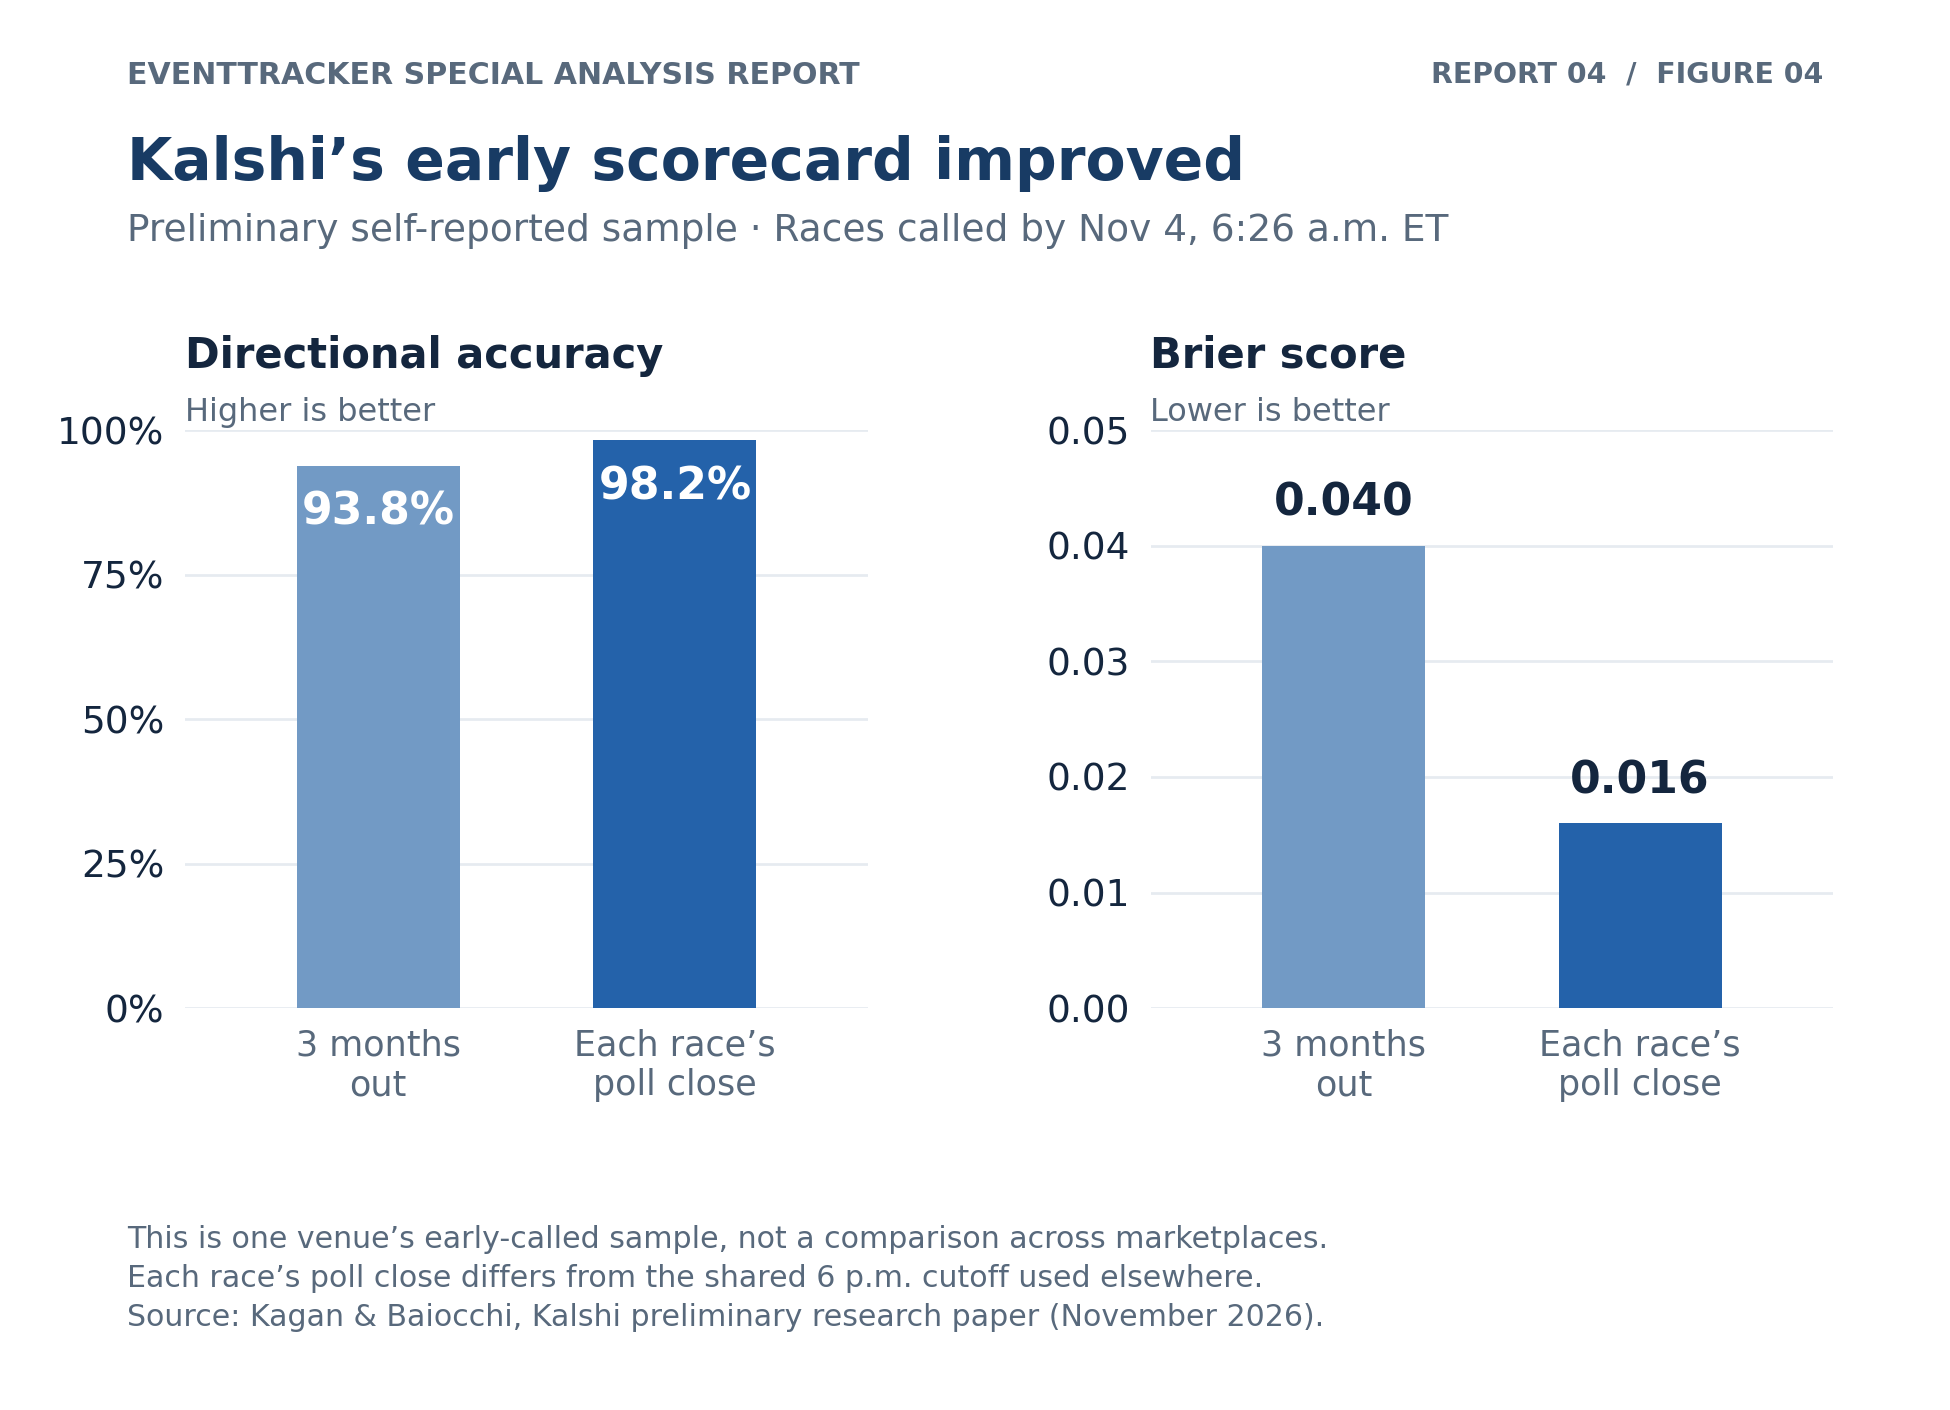
Figure 4. Metrics from Kalshi’s preliminary study for races called by 6:26 a.m. Eastern on November 4. Poll-close observations use each race’s own closing time, unlike this report’s common 6 p.m. cutoff. These company-published study results cover a different sample from Table 1 and do not rank exchanges. Only the two published horizons are shown.[8]
Polymarket international. It favored the eventual winners of both chambers and has the small two-contract scoring advantage shown above. Its public platform-wide accuracy dashboard measures resolved markets across categories at intervals before resolution. Those figures answer a broader question and cannot be relabeled as a 2026 midterm score.[15]
Polymarket US. We show it separately because it is a separate market venue. Its prices were close to those on the international platform in these examples, but similar prices do not make the order books, contracts or settlement processes interchangeable. Our small selection supports a comparison of these contracts, not a claim about every US election market.
PredictIt. RotoWire’s post-election report records a Tuesday-morning price of 79 cents for Democrats to take both chambers. That joint outcome aligned with AP’s calls. The earlier timestamp and combined proposition make it unsuitable for direct ranking against separate House and Senate contracts at 6 p.m.[9]
Interactive Brokers’ published snapshot. IBKR reported Democratic House and Senate prices of 94% and 78%, based on the highest bids that morning. That was also the correct direction. Its feed can draw on several exchanges, including ForecastEx, Kalshi and CME, so this is a brokerage-published observation, not an independently established ForecastEx-only score.[10]
Manifold. Its election page provides chamber-control markets, seat distributions and community questions. The accessible observations after election night describe expectations after results arrived. Without a comparable archived pre-election snapshot, we leave it unscored in this report.[11]
For an overall comparison, we would need the same races, the same observation time, the same price convention and a clearly stated results cutoff. A percentage built from hundreds of safe seats cannot be compared fairly with one built mostly from competitive contests.
What the overall indices told us
Kalshi’s American Power Index, KPOW, had moved to +4.9 toward Democrats on October 21, when its Senate-control market gave Democrats a 66% chance. That pre-election tilt was directionally consistent with the congressional outcome.[12]
KPOW combines current political control with expectations about future elections and government functioning. Its scale runs between maximum Democratic and Republican control; +4.9 is neither a 4.9% win probability nor a prediction of 4.9 additional seats. Its components also change as events become known. We can assess the direction of its signal, but a binary election hit rate would misdescribe what the index measures.[13]
Seat-count and wave-size contracts ask a harder question. Kalshi’s “Blue tsunami” contract specifies at least 235 Democratic House seats and 51 Senate seats. Its larger-wave contract specifies at least 250 and 56. A correct forecast of Democratic control does not automatically settle either threshold; each needs the relevant seat outcome under its own rules.[19][20]
These measures belong beside one another, with their meanings intact: chamber-control probabilities, seat totals, composite power indices and forecast-performance scores each describe a different aspect of the election.
Where the big tickets went
Issue 03 recorded more than $20 million in October trades of at least $2,000 across four US midterm markets on Polymarket international: House control, the balance of power, the Texas Senate race and Senate control. That was an early measure of attention and trading activity.[1]
It was not a measure of how much those traders ultimately earned. Trades can include purchases, sales, hedges and repeated turnover. Assessing a wallet’s performance would require its entry prices, exits and remaining positions. Large trading volume alone establishes neither conviction in one direction nor forecasting skill.
Kalshi subsequently reported more than $2.5 billion of midterm trading. It also said its Democratic House-control price reached 99% at 8:10 p.m. Eastern on election night and its Senate-control price passed 99% at 9 p.m. Those are the company’s reported market milestones.[18]
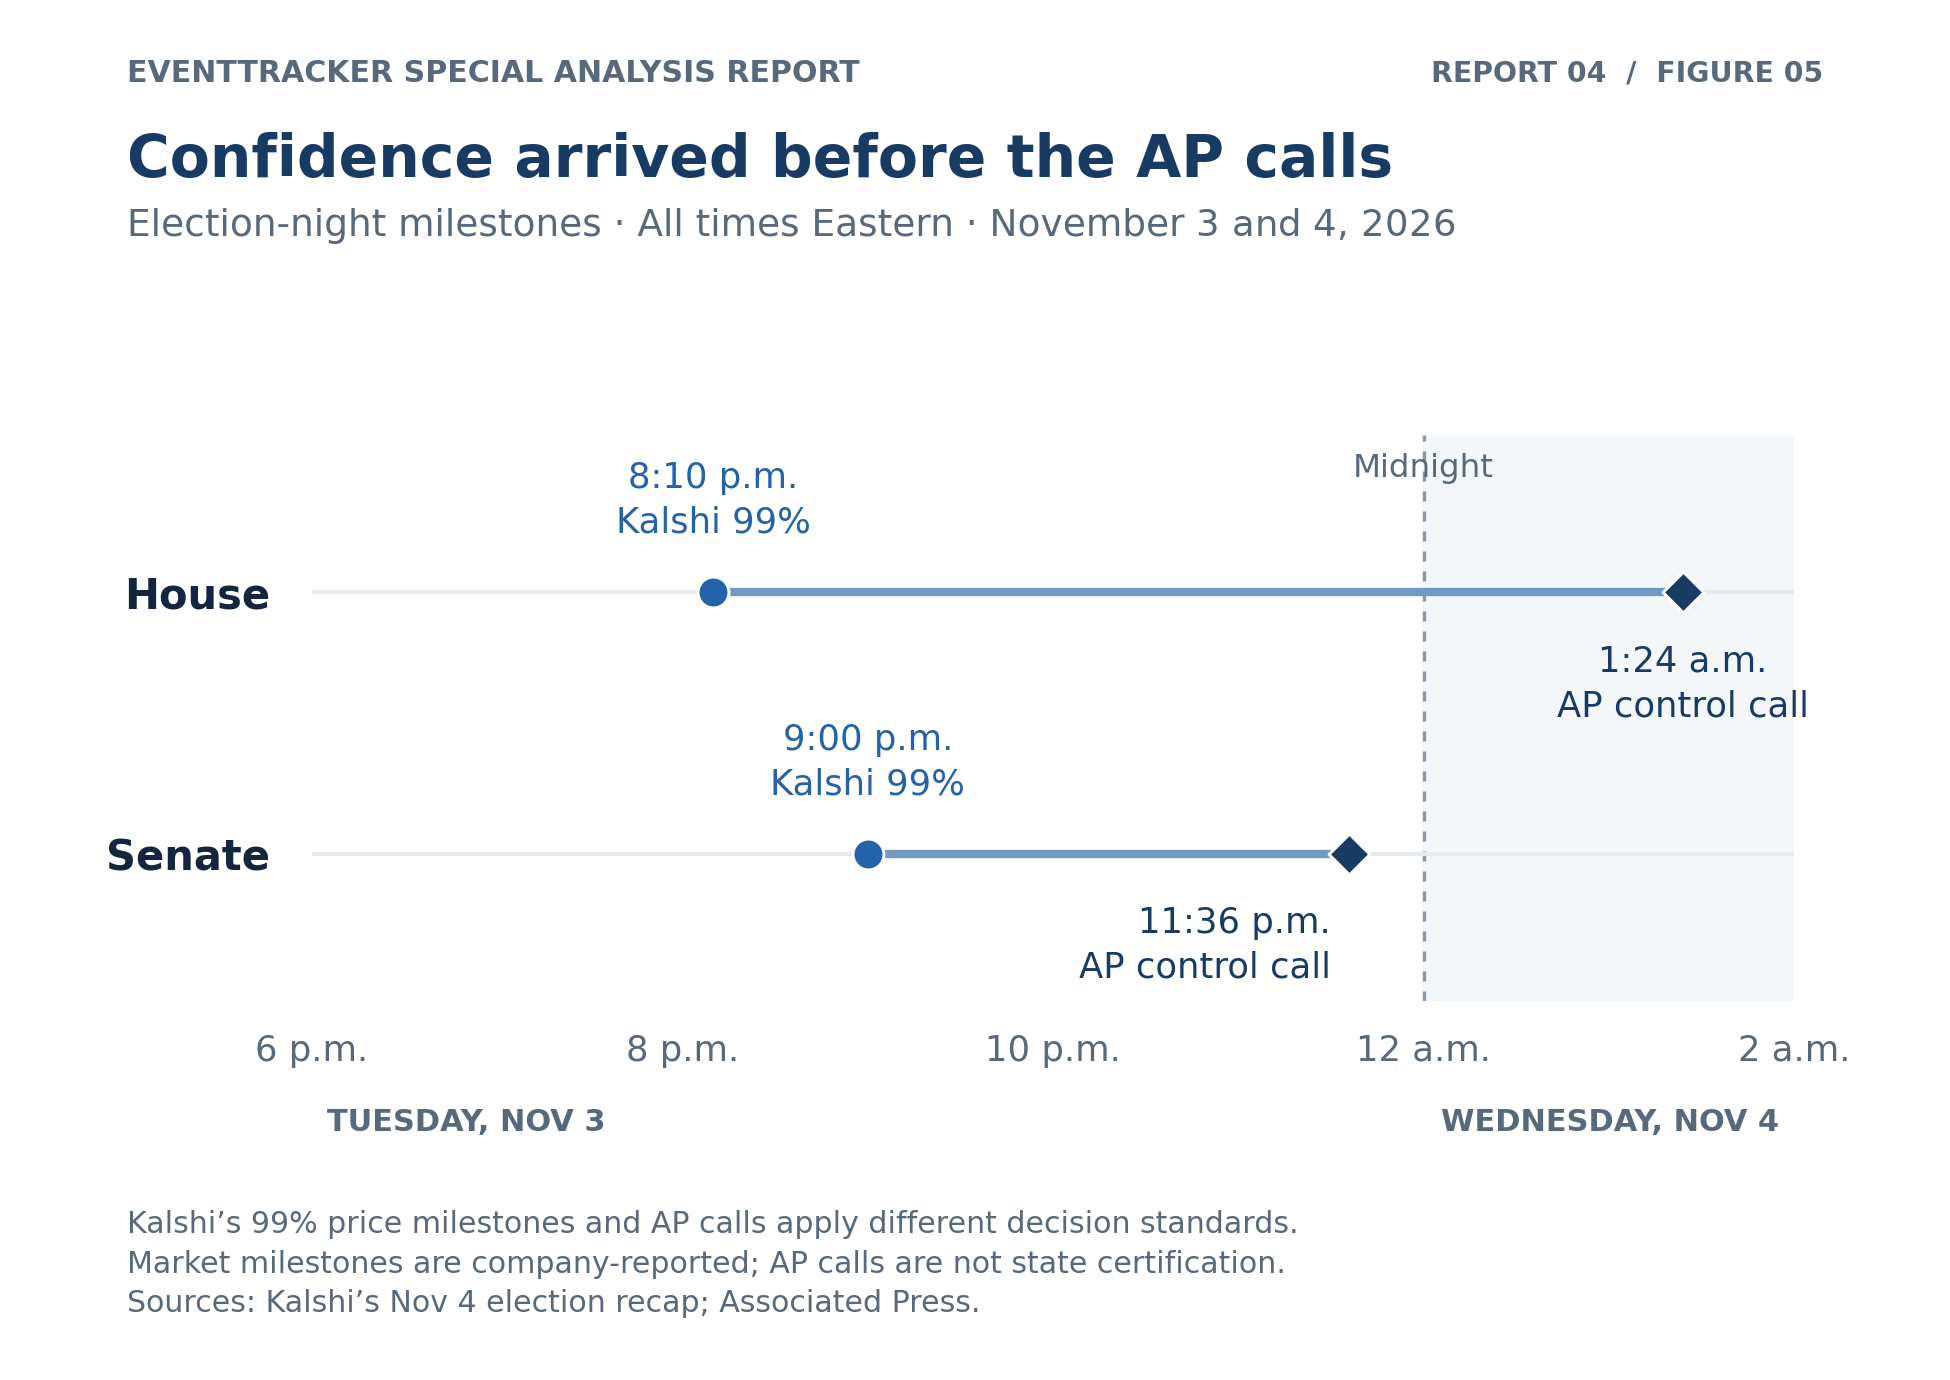
Figure 5. Company-reported Kalshi 99% price milestones beside AP’s congressional-control calls, all in Eastern time. The elapsed gaps were 5 hours 14 minutes for the House and 2 hours 36 minutes for the Senate. The markers represent different evidence thresholds; the timing comparison is not a measure of pre-election forecasting accuracy.[18][2]
Their timing illustrates a useful distinction. A price can respond rapidly to incomplete returns while a news organization waits for evidence sufficient to call the result. Speed of updating is valuable, but it should be evaluated separately from the accuracy of a forecast made before the count.
What we are watching after election night
- Certification. South Carolina’s scheduled certification is November 10. North Carolina’s county canvass is November 13, with its state canvass on November 24; Iowa also schedules its state canvass for November 24. Reported counts can change during those processes.[5][17][6]
- The final size of the majorities. The remaining races matter particularly for seat bands, victory margins and combinations requiring several outcomes. A called chamber does not finish every related contract.
- Settlement rules. We are watching when each venue resolves, which authority its terms name, and whether a contract concerns an election winner, a certified total or officeholders actually taking their seats.
- A complete accuracy sample. Pending contests should remain pending in the scorecard. Excluding the hardest unresolved races can make an early headline percentage look more impressive than the eventual record.
The midterms on ET&
This election shows the value of seeing the same question across venues, with the price, its age and the contract terms beside it. Close agreement helps identify a consensus; a gap invites a closer look at whether the markets really ask the same thing.
ET&’s Cross-Venue boards and live fair-price tools help you make those comparisons. ET& also adds top-market repricing about every 45 seconds, price-gap alerts and Telegram notifications, with up to 50 event follows and 50 wallet follows. A free account includes a watchlist of one event and one wallet; alerts come with ET&.[16]
ET& remains $22 a month or $199 a year, with a seven-day free trial. We will keep separating activity from accuracy, and market prices from the evidence used to resolve them.[16]
See everything ET& adds · Start your free trial
The broad congressional forecast held up. The individual races give us the more useful record: where traders had confidence, where they were nearly indifferent, and where a less likely outcome arrived. That is the record we want readers to see, with enough detail to judge the next forecast for themselves.
Tal Ayalon
Co-Founder & CEO, PodComet LLC
Method and sources. Prepared November 7, 2026. Cross-venue prices are ThinBlimp’s published November 3, 6 p.m. Eastern snapshot, not a new extraction from EventTracker’s archive; they have not been independently reconstructed from exchange trade feeds here. The two-contract Brier scores are our calculations, equally weighting House and Senate and using AP calls as the provisional outcome benchmark. Official-source tallies retain their stated snapshot times and remain distinct from certification and venue settlement. Other published observations are separately dated and attributed. No investment returns or complete marketplace ranking are inferred. EventTracker is an independent, unaffiliated, display-only aggregator. We take no wagers and hold no funds. Nothing here is investment or wagering advice.
Sources
- EventTracker Issue 03: Parlays and Ballots. October whale-tape baseline.
- Associated Press: Calling control of Congress in the 2026 midterm elections. Congressional and Senate race calls.
- Texas Secretary of State: November 3 election results. Update printed November 4, 4:59 p.m.; all listed candidates and write-ins included in calculated margins.
- South Carolina Election Commission: Results downloads, including the midnight election-night spreadsheet. This is a historical snapshot.
- South Carolina Election Commission: Public notices. November 10 certification meeting.
- Iowa Secretary of State: November 4 election update. Results unofficial until November 24 state canvass.
- ThinBlimp: Frozen 2026 midterm prices. Original third-party collection, November 3, 6 p.m. Eastern; separate US and international Polymarket observations.
- Kagan and Baiocchi: Kalshi and the 2026 Midterms: Calibration and Accuracy. Preliminary working paper, November 2026.
- RotoWire: How Accurate Were the 2026 Midterm Markets? November 4; source for PredictIt’s Election Day morning joint-outcome price.
- Interactive Brokers: Election Day majority-contract snapshot. November 3; highest morning bids; multi-exchange feed disclosure.
- Manifold: Election markets. Live dashboard, not an archived pre-election benchmark.
- Kalshi: October 21 KPOW update. Pre-election index observation.
- Kalshi: American Power Index methodology. Composite political-control measure.
- Kalshi: Final 2026 midterm odds. November 2, noon Eastern snapshot.
- Polymarket: Accuracy dashboard and methods. All-category, resolution-relative metrics.
- EventTracker: Why get ET&? Current features, follow allowances and pricing.
- North Carolina State Board of Elections: What’s next for finalizing the midterms? November 4; canvass dates and remaining count.
- Kalshi: November 4 midterms recap. Company-reported volume and election-night price milestones.
- Kalshi: Blue tsunami contract. Threshold: 235 House and 51 Senate seats.
- Kalshi: Biggest blue wave since 2008 contract. Threshold: 250 House and 56 Senate seats.