

Read or download this post as a PDF (3 pages, 433 KB)
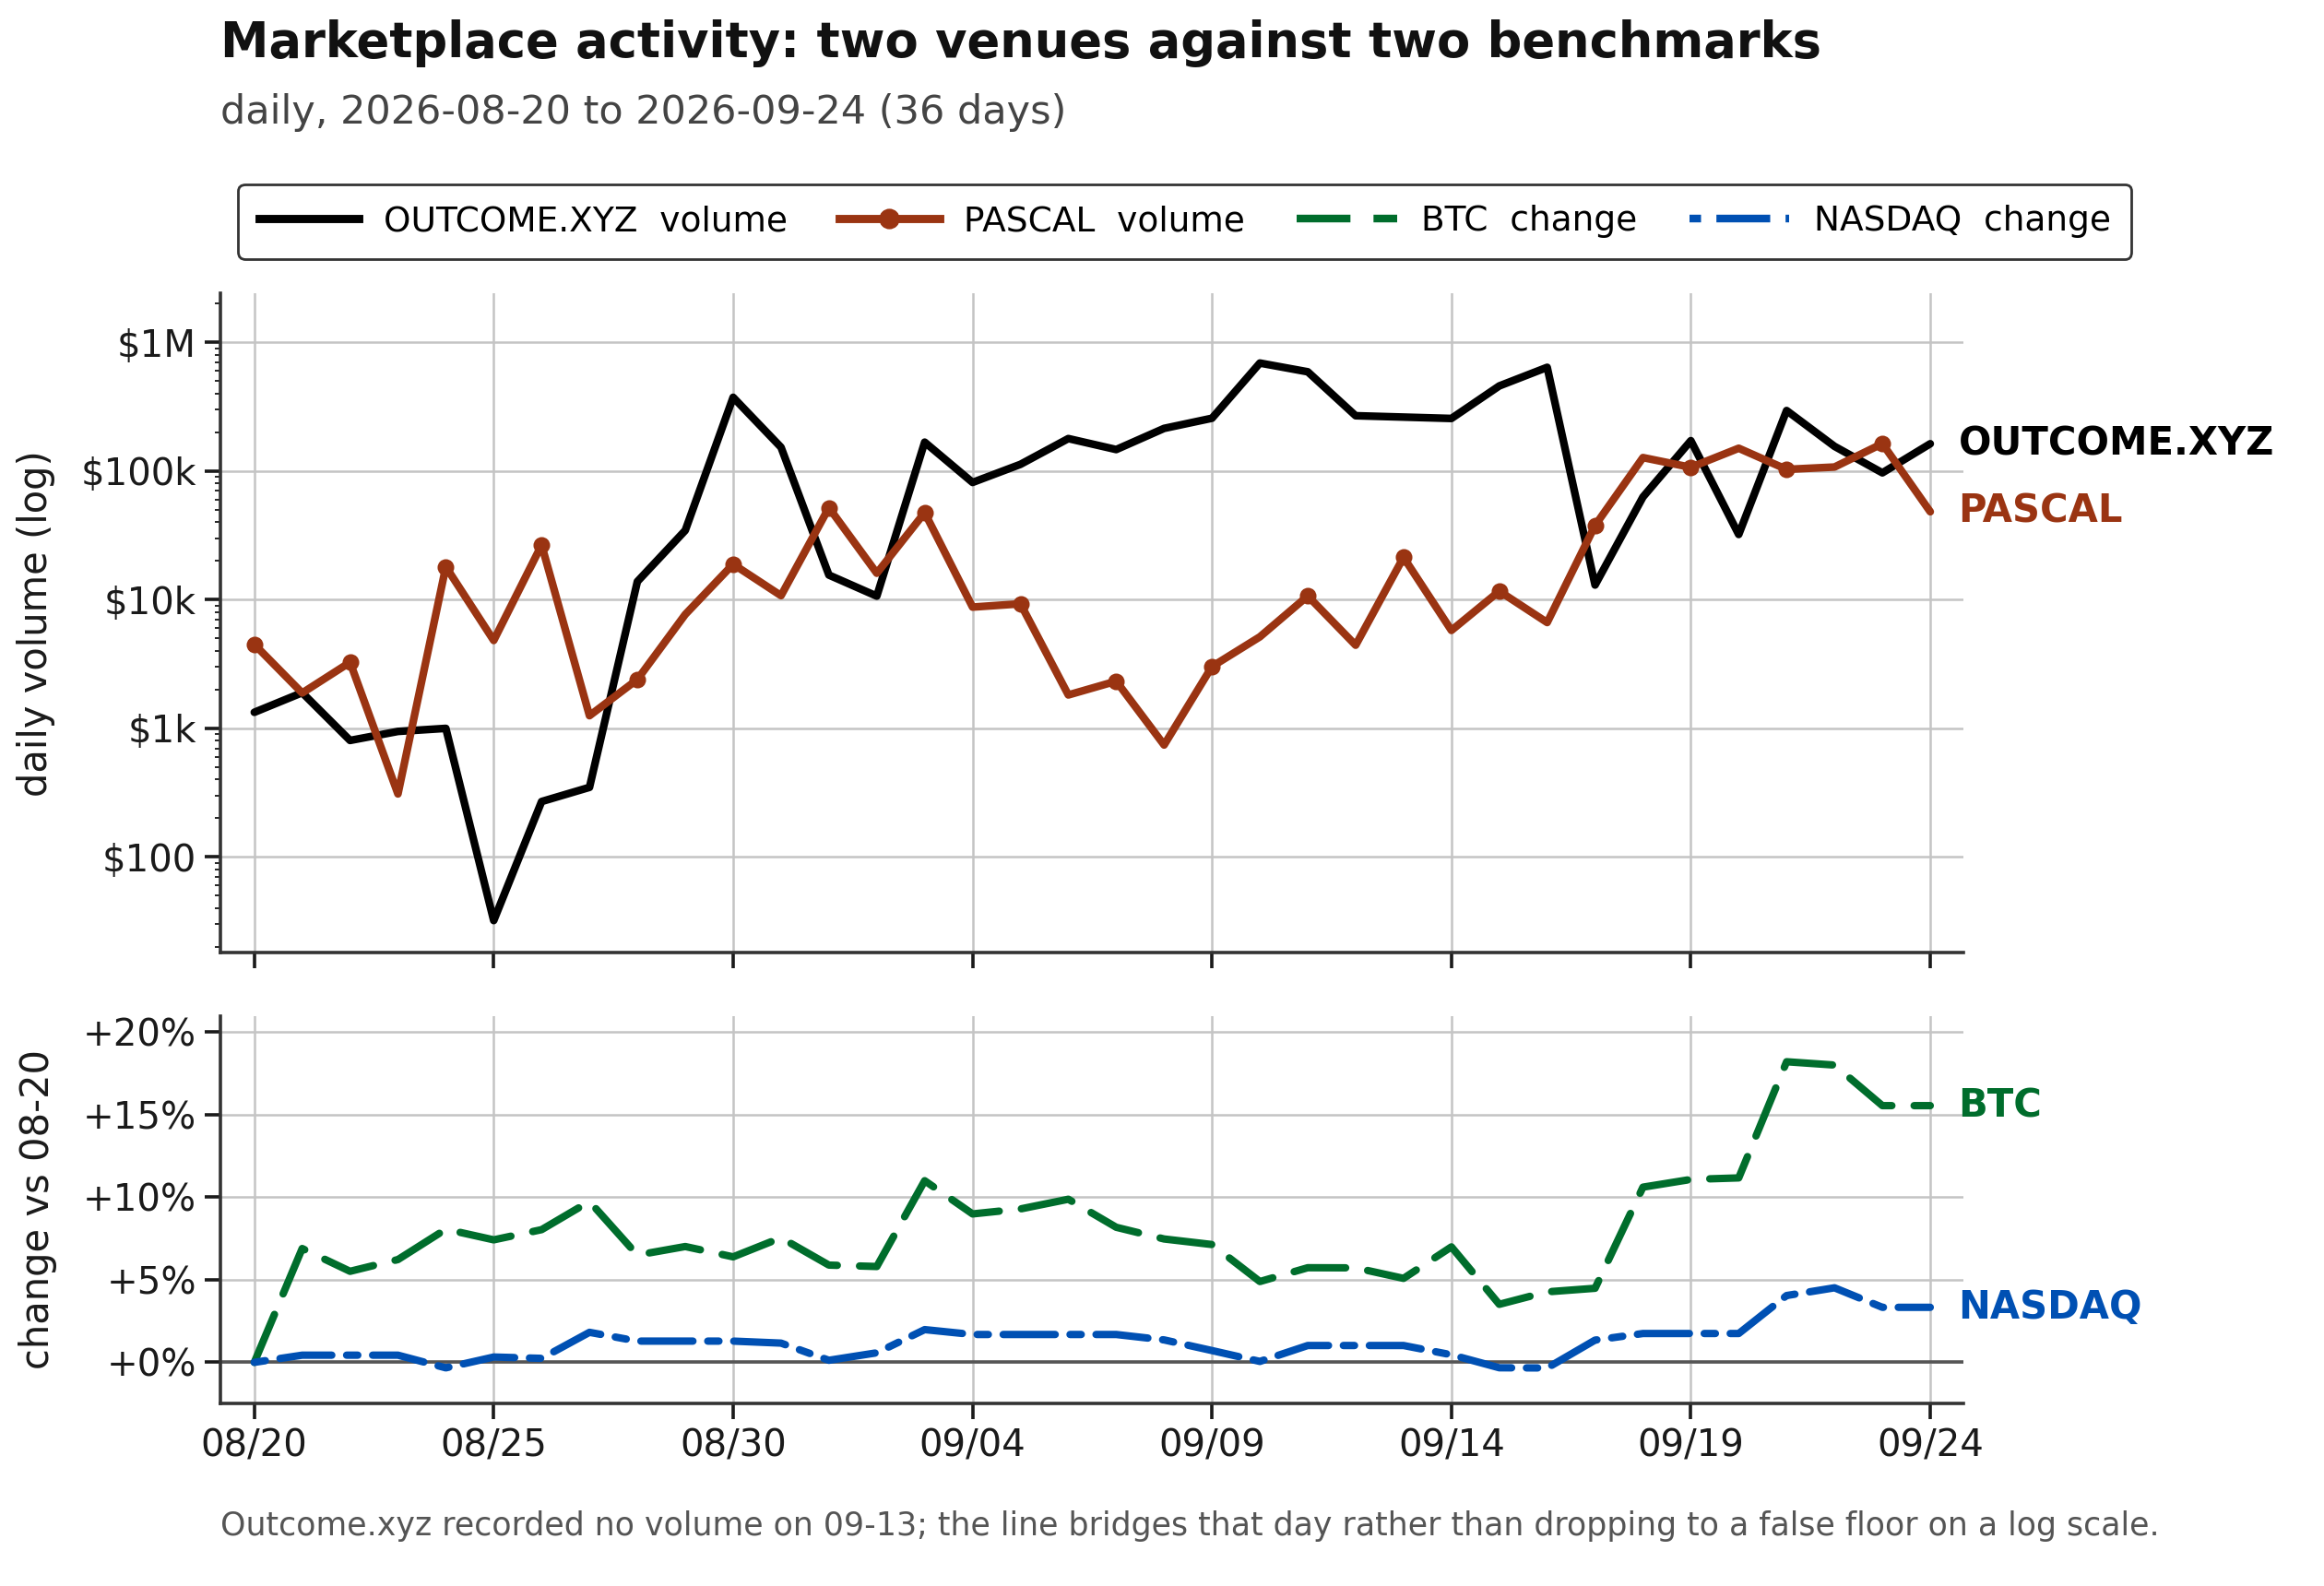
Four lines, 36 days, from August 20 to September 24.
The top panel is the daily money changing hands on two of the smallest venues we track: Outcome.xyz as the solid black line, Pascal as the solid red line with dots on it. That scale is logarithmic, so growth there is exponential.
The bottom panel is the same 36 days for two benchmarks, drawn as percentage change from August 20 for comparison.
Over those 36 days bitcoin gained 15.6% and touched 18.2% at its best. The Nasdaq gained 3.3%. The S&P 500, which is not drawn here, gained 0.85%. Gold lost 4.4%. That is the scale the two solid lines are being measured against, and both of them left it far behind.
Pascal: the clean one
Pascal averaged $5,467 a day in the first six days of the window. In the last six it averaged $113,142. That is a factor of about twenty in five weeks, with a peak day of $163,261 on September 23 and $1.15 million over the whole window.
What makes this number trustworthy is the thing that did not change. Across all 36 days the number of Pascal markets we were reading moved around between roughly 665 and 1,275, with no step, no jump, no new day where the count suddenly doubled. Same book, same reader, roughly the same number of questions listed, and about twenty times the money going through them. Per market per day, activity went from around $11 to around $72.
The step change is easy to date: September 18. Before it, Pascal cleared $100,000 on a day exactly zero times. After it, six days out of seven.
Outcome.xyz: a restart, not a launch
Outcome.xyz is the bigger mover and the more interesting story. It averaged $1,002 a day in the first six days of the window and $152,420 a day in the last six, with a peak of $690,095 on September 10 and $5.66 million over the window.
The reason that is not simply a bigger version of Pascal's story is the book. For the first nine days of this chart, Outcome.xyz had exactly one live market. Then it came back. Two markets on August 29, five by September 4, sixteen by September 6, twenty six by September 8, and a peak of 45 on September 16. The money followed the same curve, from a few hundred dollars a day to six figures.
So Outcome.xyz did not grow 150 times over. It restarted. A venue whose live book had wound down to one question rebuilt itself to roughly thirty in three weeks, and the trading came back with it. That is a strong sign in favor of the guys at Outcome!
Where these two actually sit
Across the 36 days we recorded $11.48 billion of volume across 24 venues that traded at all. Kalshi took 45.4% of it and Polymarket took 22.7%, so those two alone took 68 cents of every dollar. Rothera, Opinion and UDX come next, and then the numbers fall off a cliff.
Outcome.xyz is 0.049% of that total. Pascal is 0.010%. Together they are about six cents in every hundred dollars. They rank 17th and 18th out of 24.
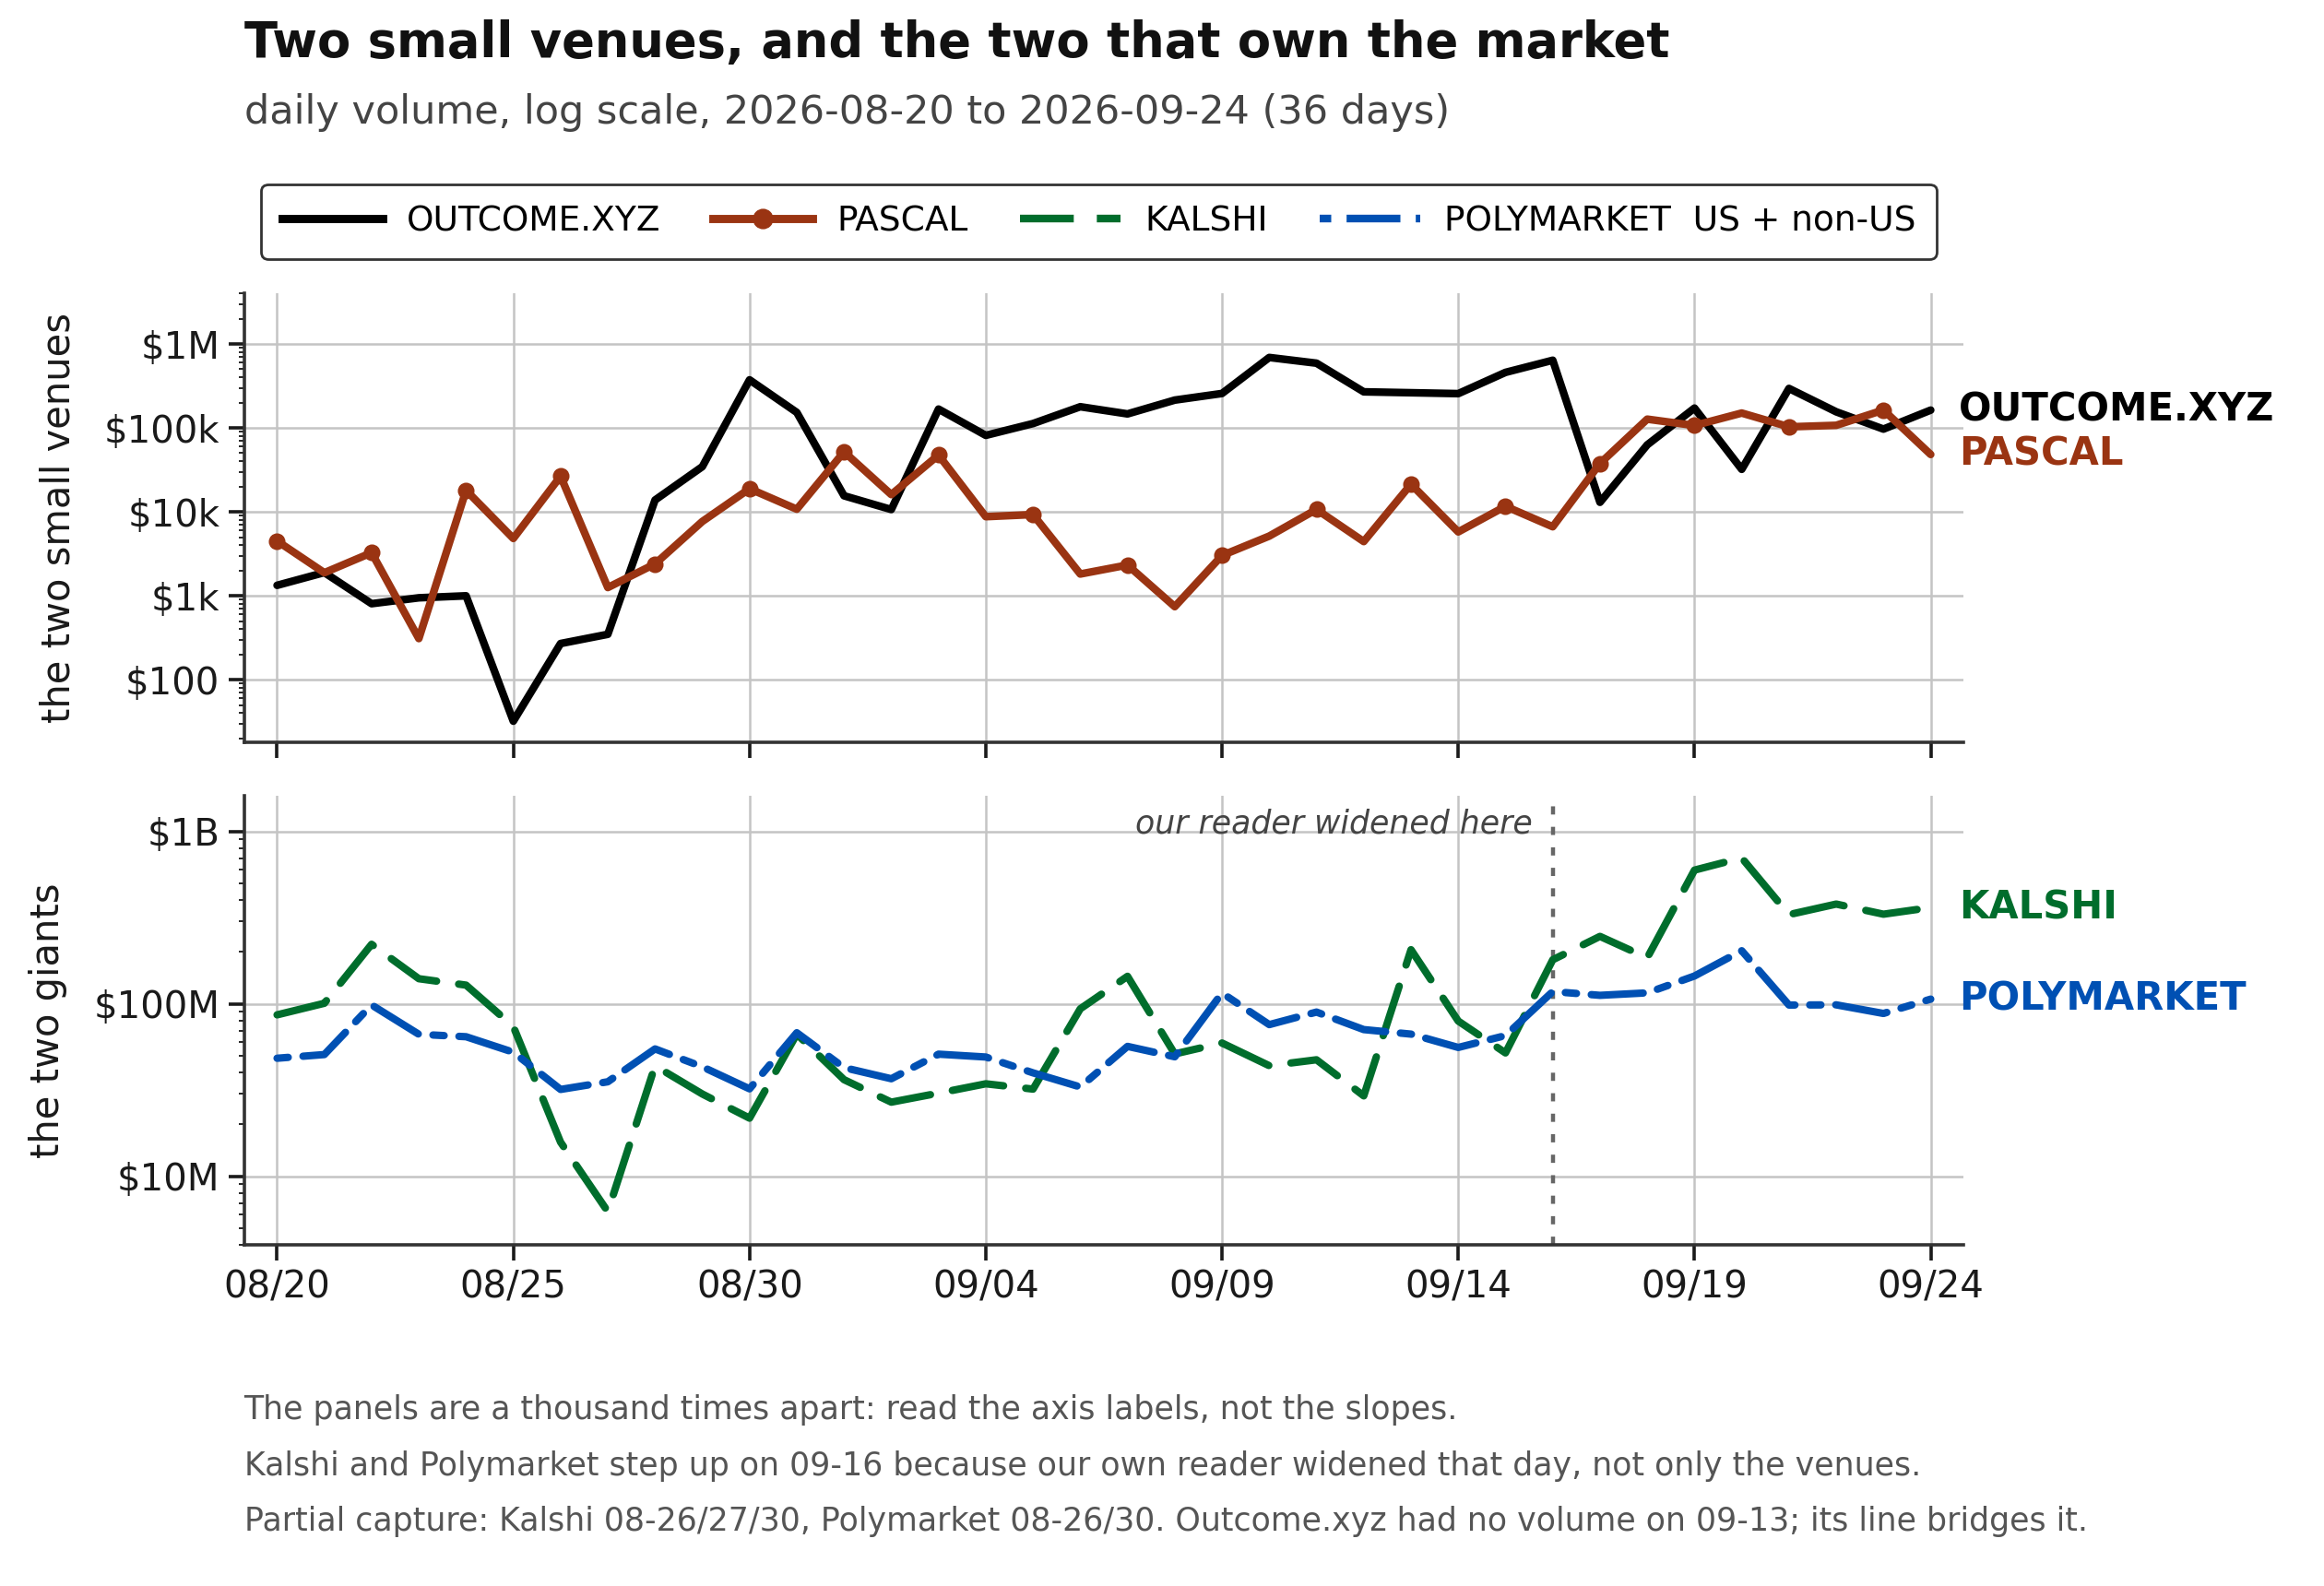
That is not a reason to ignore them. It is the reason to look at them. The top of this market is two venues whose weekly change is measured in single digit percentages, and the bottom of it is where new venue designs actually get tested: a Hyperliquid-based binary market in Outcome.xyz's case, a Solana-based exchange in Pascal's.
What we will be watching
Whether Pascal's step change holds past the end of September, or whether September 18 turns out to have been one event and one crowd. Whether Outcome.xyz's book keeps widening or settles back toward the handful of markets it ran all summer. And whether either of them starts showing up in the cost measurements rather than just the volume ones, because a venue that gets busy without its spreads tightening is a venue that got popular, not a venue that got good.
Thank you for reading.
Tal Ayalon eventtracker.ai
Figures are EventTracker's own measurements for August 20 to September 24, 2026, pulled September 24. EventTracker is an independent, unaffiliated, display only aggregator. We take no wagers, we hold no funds, and no venue pays us for coverage or placement. Nothing here is investment or wagering advice.